From 3 to 50+ FPS: Rescuing Web Performance by Pinpointing Long Tasks
TLDR; A walkthrough of how to identify and solve web performance issues using Chrome DevTools and react-scan.
I was working on building an AI chat web application at my current job. When I took over this codebase and started building new features, I soon found a serious performance issue, as shown in the video below:
As you can see from the FPS number at the top-right of the screen, it dropped to 3 FPS when performing heavy rendering tasks like syntax highlighting or custom markdown, and the browser would freeze in the worst cases. This issue had a bad effect on daily development, not to mention the production environment.
Chrome devtools
So I opened Chrome DevTools, switched to the Performance tab, and recorded a flame graph to pinpoint where the issue was coming from.
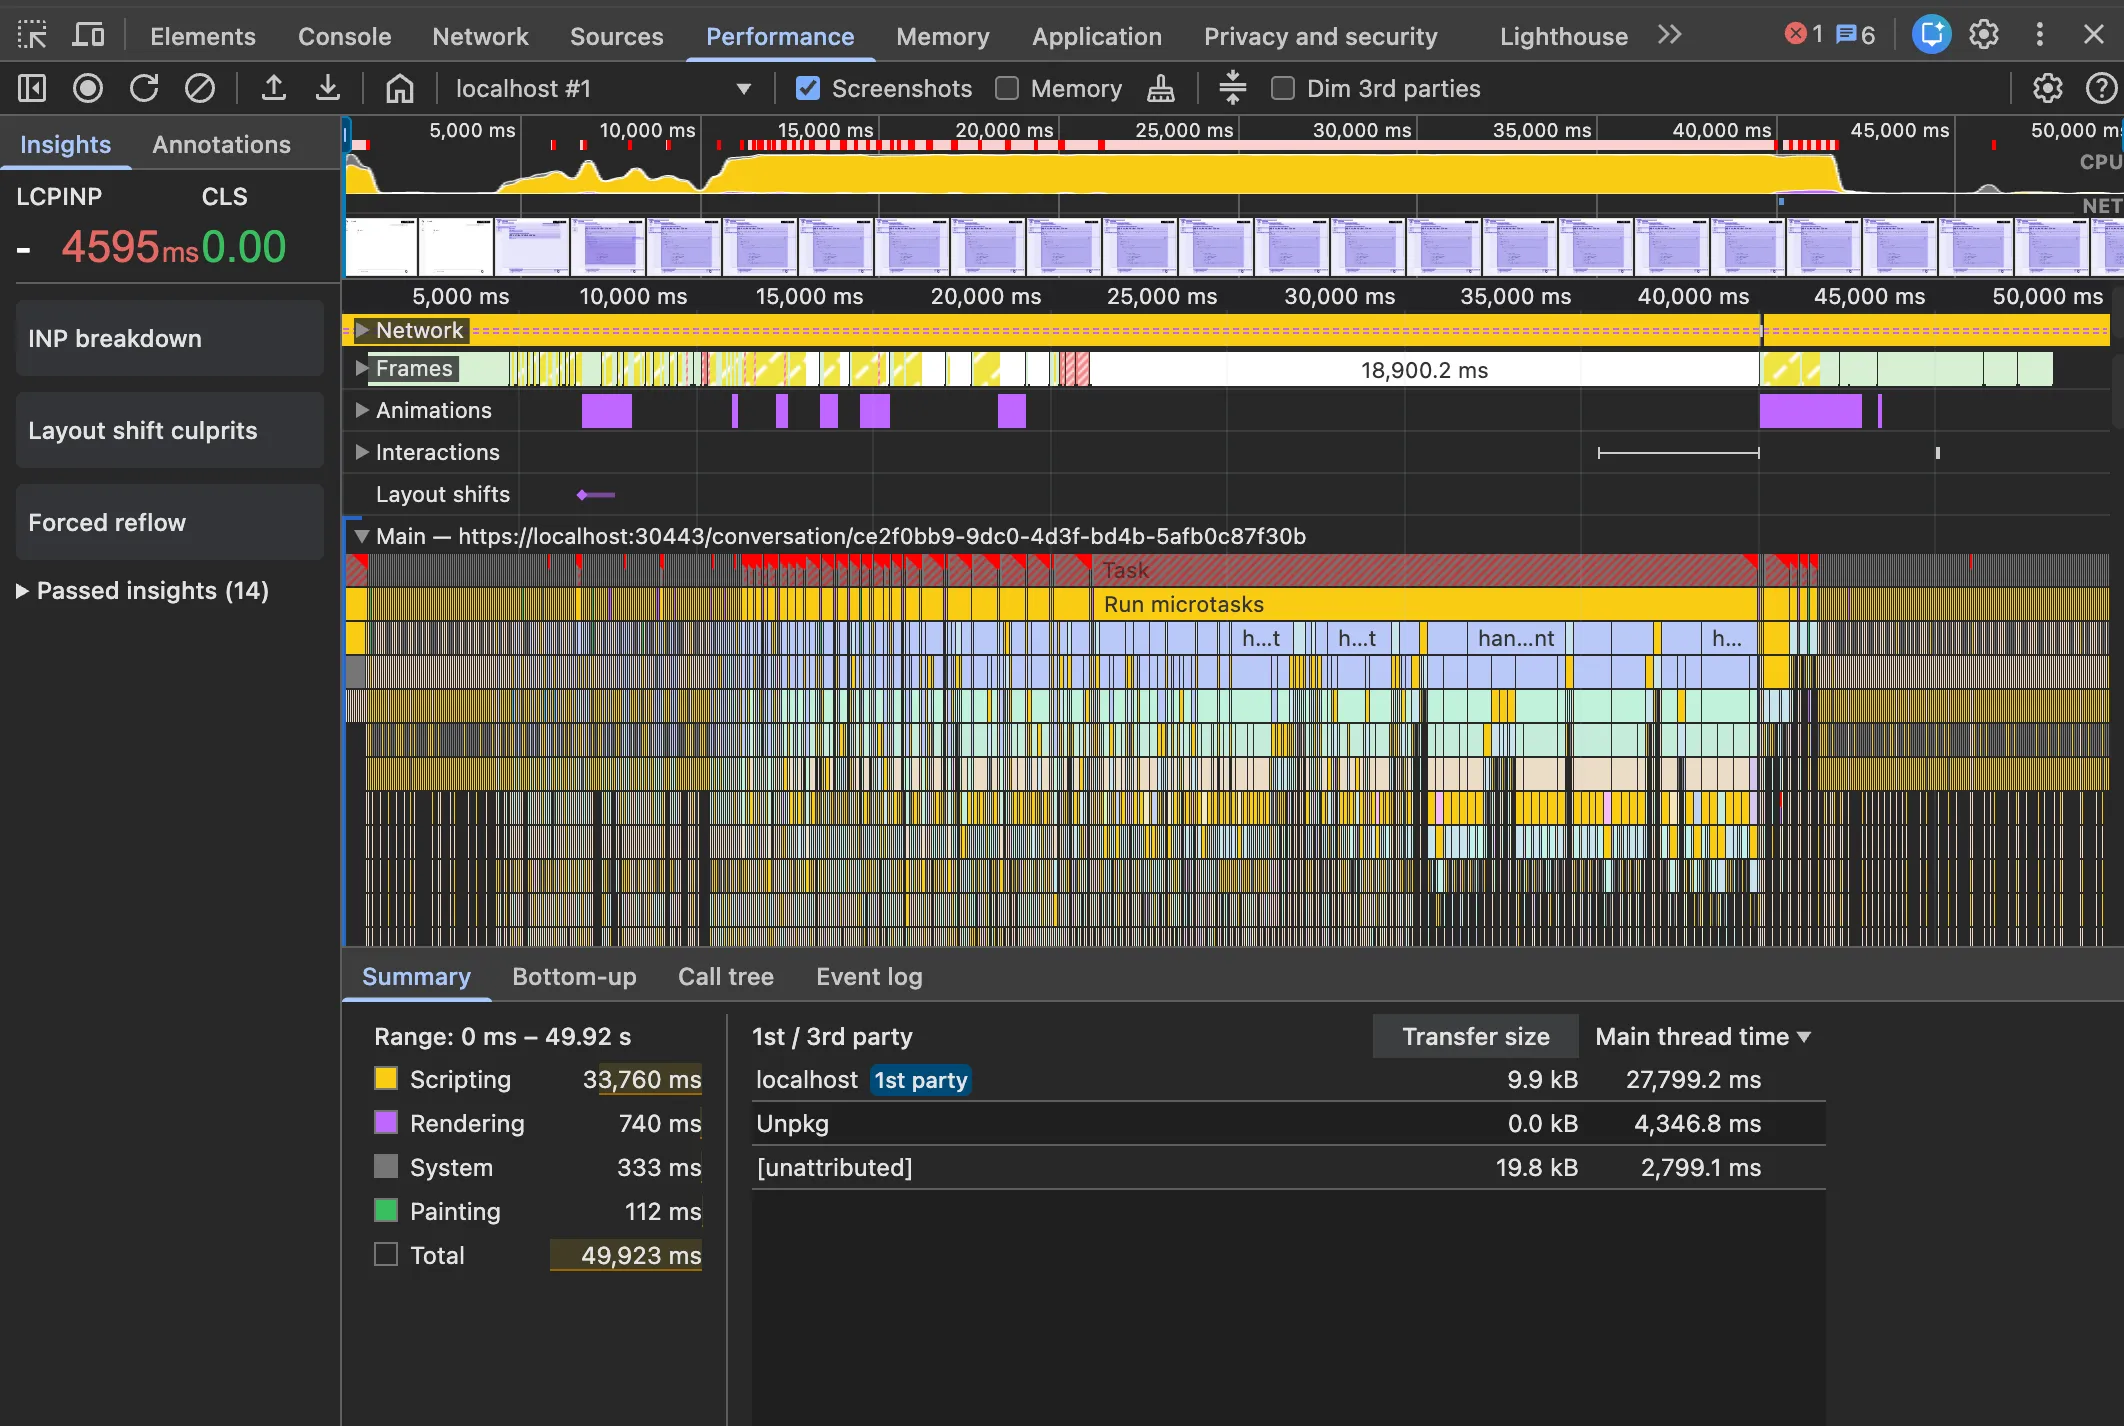
From the flame graph, we can see there were a lot of long tasks causing the browser to freeze. Clicking into one of the long tasks:
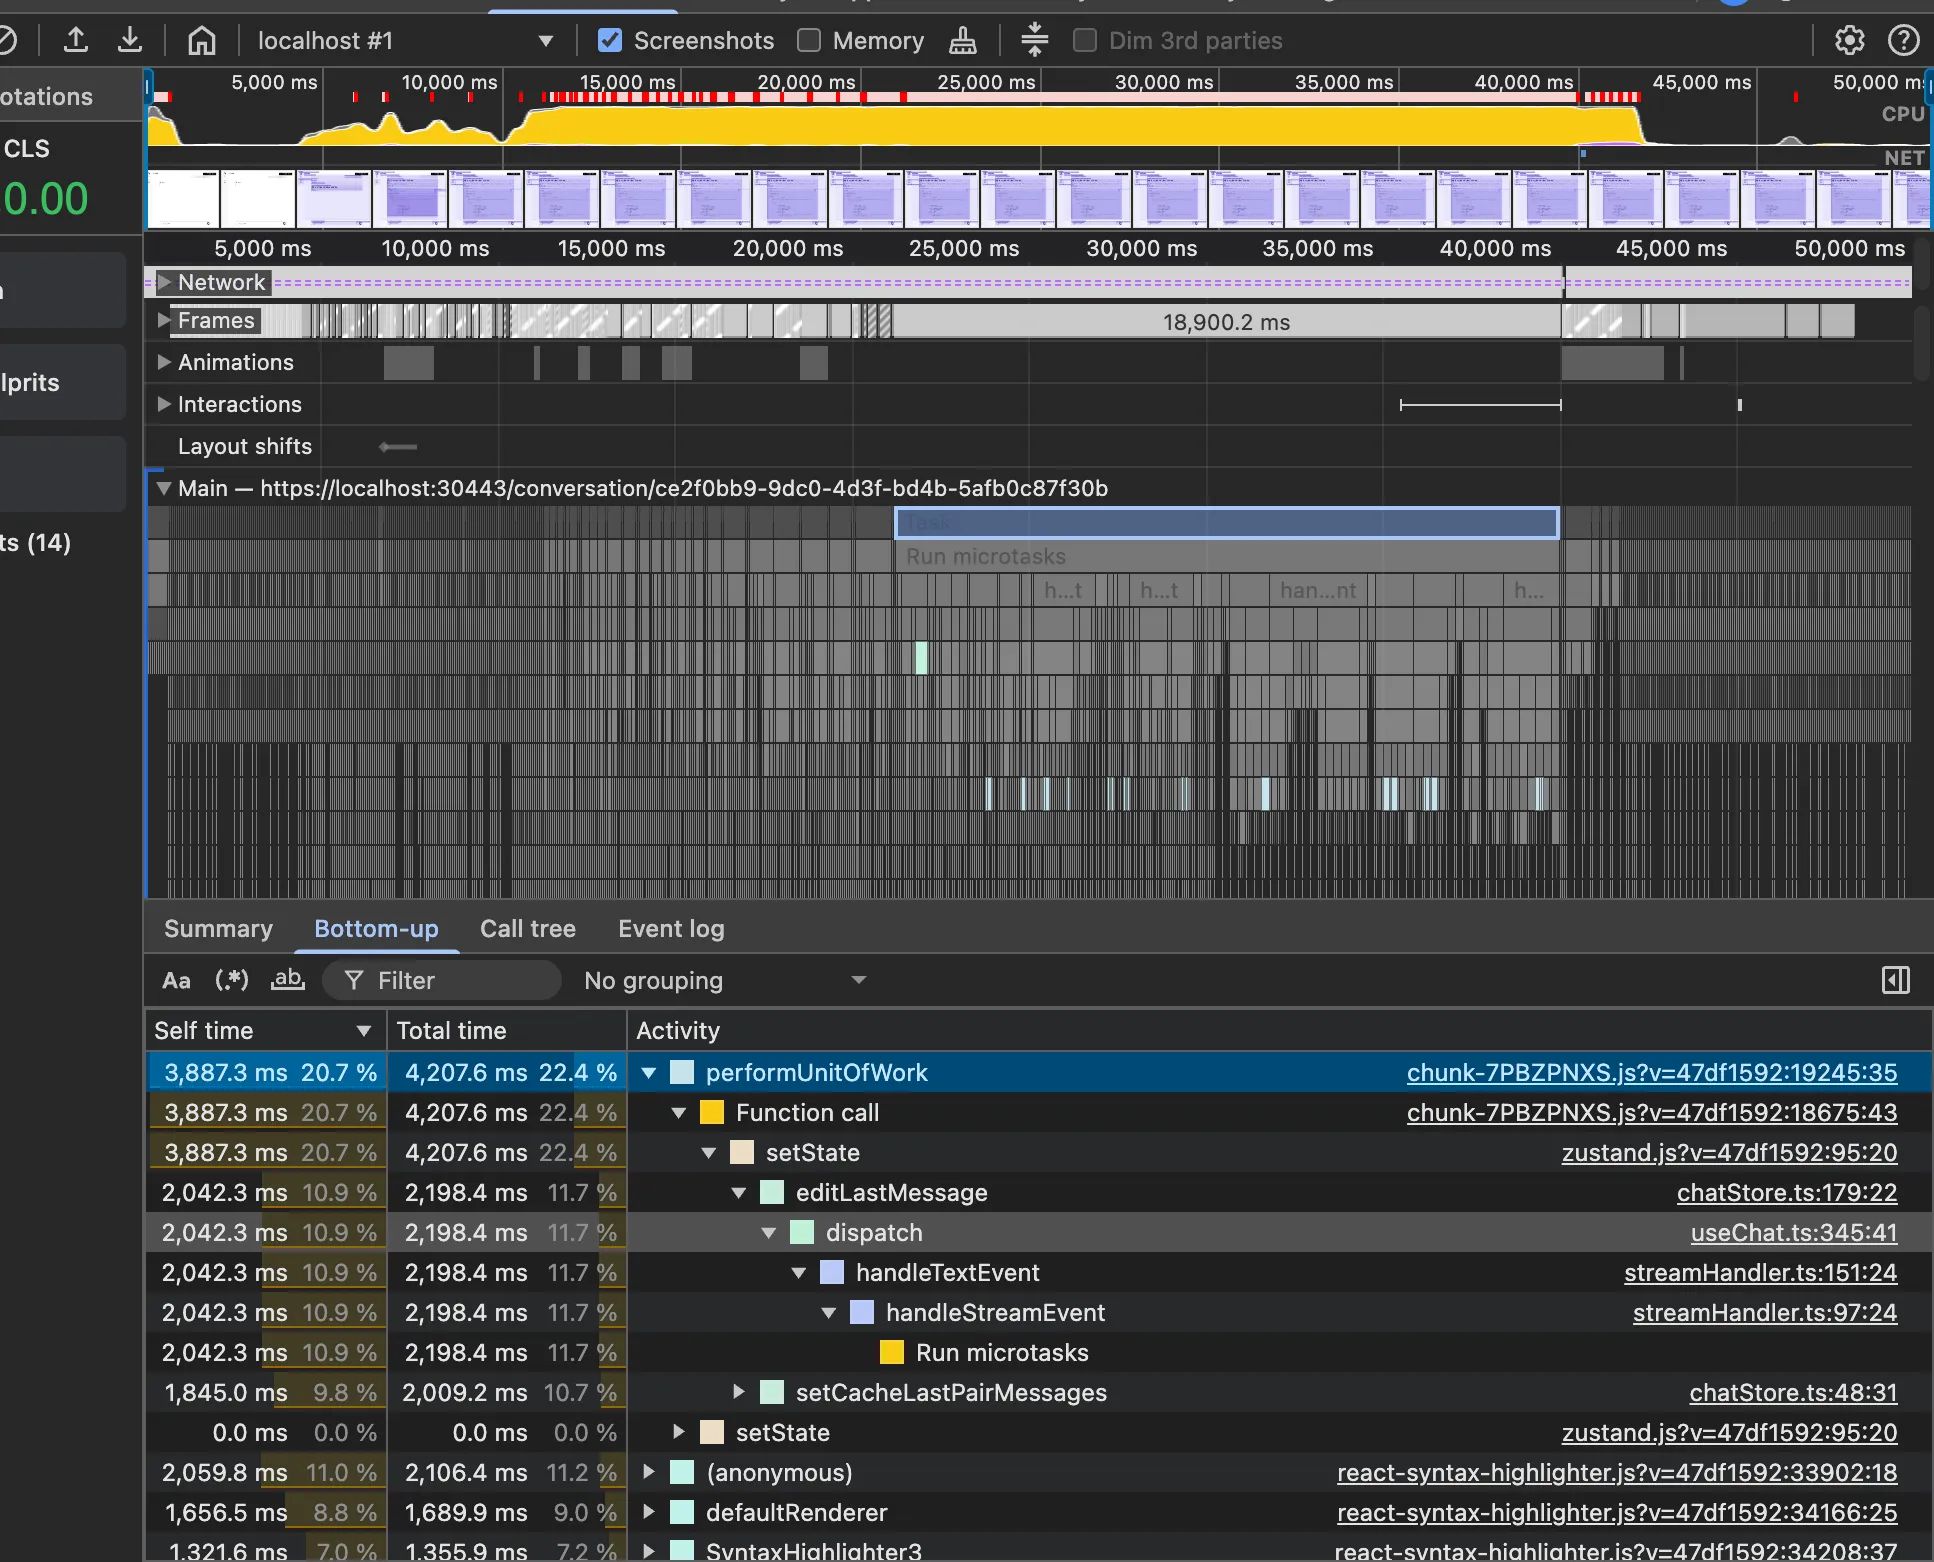
It seems like the browser spent a lot of time processing the logic we defined in zustand and handlers. This is a good sign, now we know where we can solve the problem.
react-scan
react-scan is a useful tool that automatically detects performance issues in your React app. I learned about it from X (formerly Twitter) posts, and it proved really helpful.
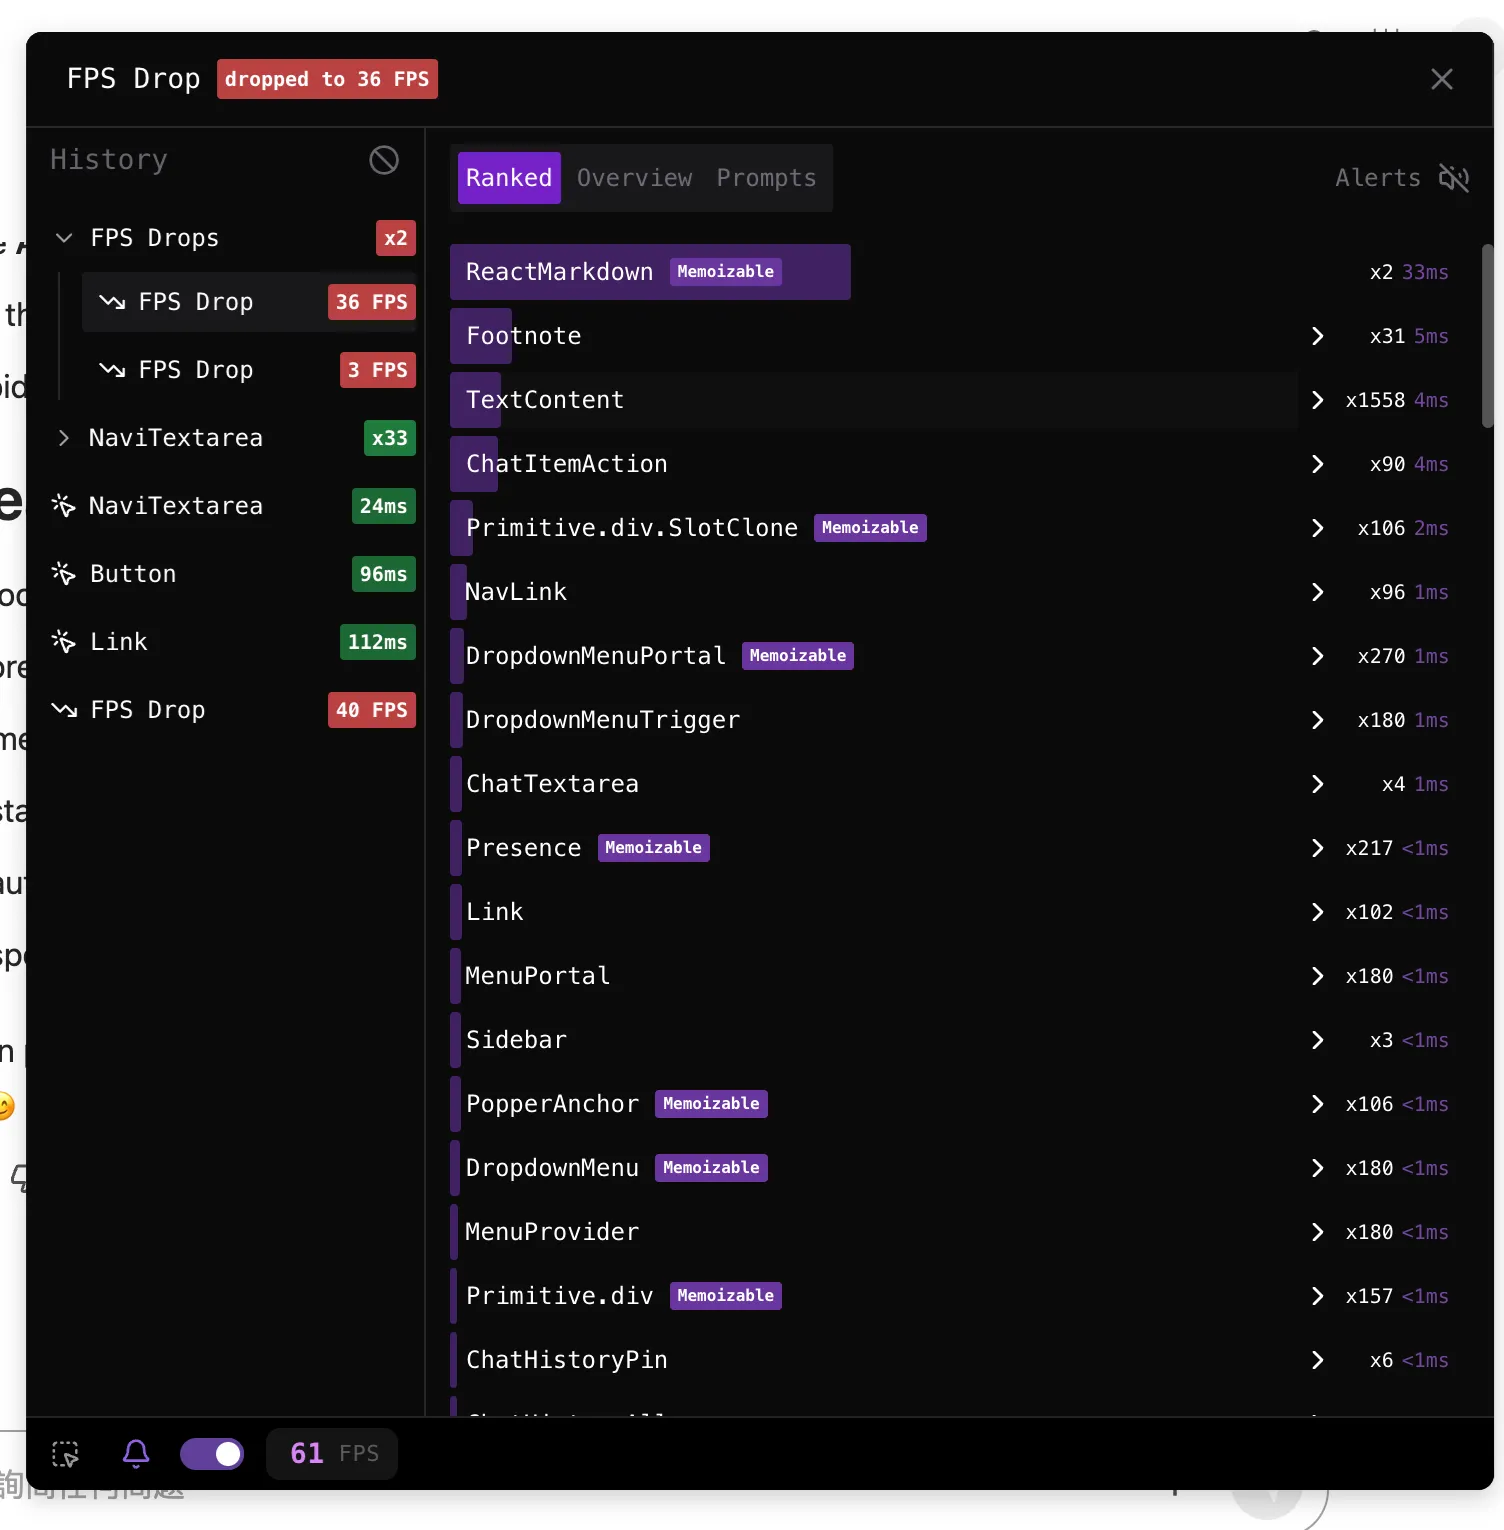
After installing react-scan and trying to reproduce the issue again, I found there was a performance issue when rendering those syntax-highlighted code blocks:
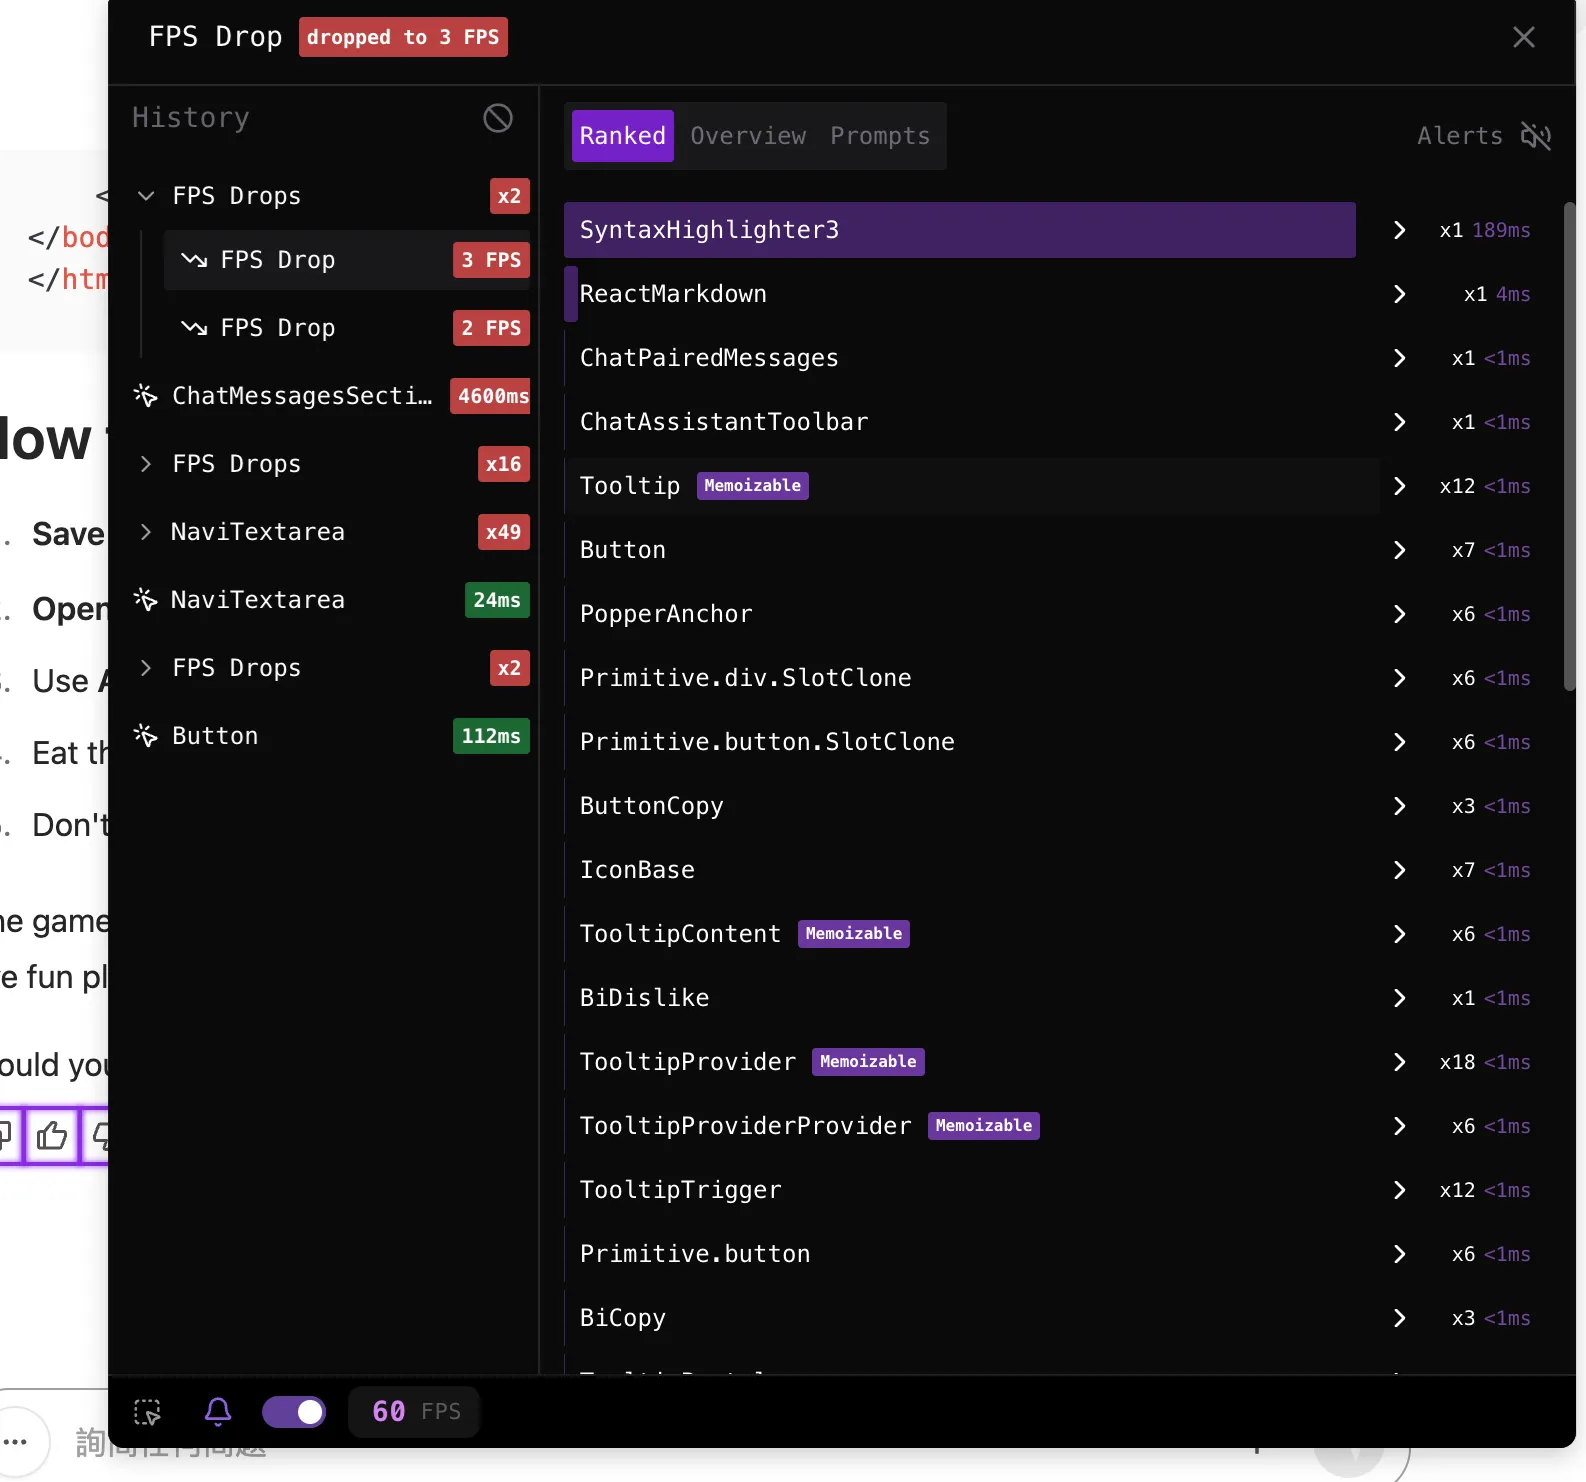
In the codebase, we used react-syntax-highlight for syntax highlighting. It was easy to set up and worked great in the React app, but it had a performance issue on re-rendering. I found several GitHub issues discussing this problem. So I decided to migrate it to rehype-highlight, which is compatible with react-markdown and faster for re-rendering use cases.
Root cause
Based on the info I gathered, I looked into the codebase to find the problem. It turned out to be a skill issue: the browser’s main thread got stuck due to too many microtasks. Here is the sample code:
// Called on every stream chunk
async function streamEventHandler(event) {
	if (event.type === 'text') return asyncJob('text', event.data);
	if (event.type === 'image') return asyncJob('image', event.data);
	if (event.type === 'end-event') return asyncJob('end-event', event.data);
	// ...
}

async function asyncJob(type, data) {
	handlerSyncJob(data);
	if (type === 'end-event') {
		await endStreamEvent();
	}
	//...
}
The problem is that streamEventHandler is called on every stream chunk, which could be hundreds or thousands of times. Even though asyncJob() only actually awaits something on the end-event, the fact that it’s an async function means it always returns a Promise. This creates a cascade of microtasks:
- Create a Promise for every single stream chunk
- Queue all these Promises as microtasks in the event loop
- The browser processes all these microtasks before moving to the next macrotask (like rendering)
- With hundreds of microtasks to process, the main thread is blocked long enough that rendering can’t happen—creating a long task
The solution is to only use async when you actually need to await:
// Fixed version
function streamEventHandler(event) {
	if (event.type === 'text') return handlerSyncJob(event.data);
	if (event.type === 'image') return handlerSyncJob(event.data);
	if (event.type === 'end-event') return asyncJob(event.data);
}

async function asyncJob(data) {
	handlerSyncJob(data);
	await endStreamEvent(); // Only this path is async
}

function handlerSyncJob(data) {
	// Pure synchronous logic, no Promise
}
Now only the end-event creates a Promise, avoiding the microtask overflow. After adjustments, the long tasks in flame graph reduces a lot:
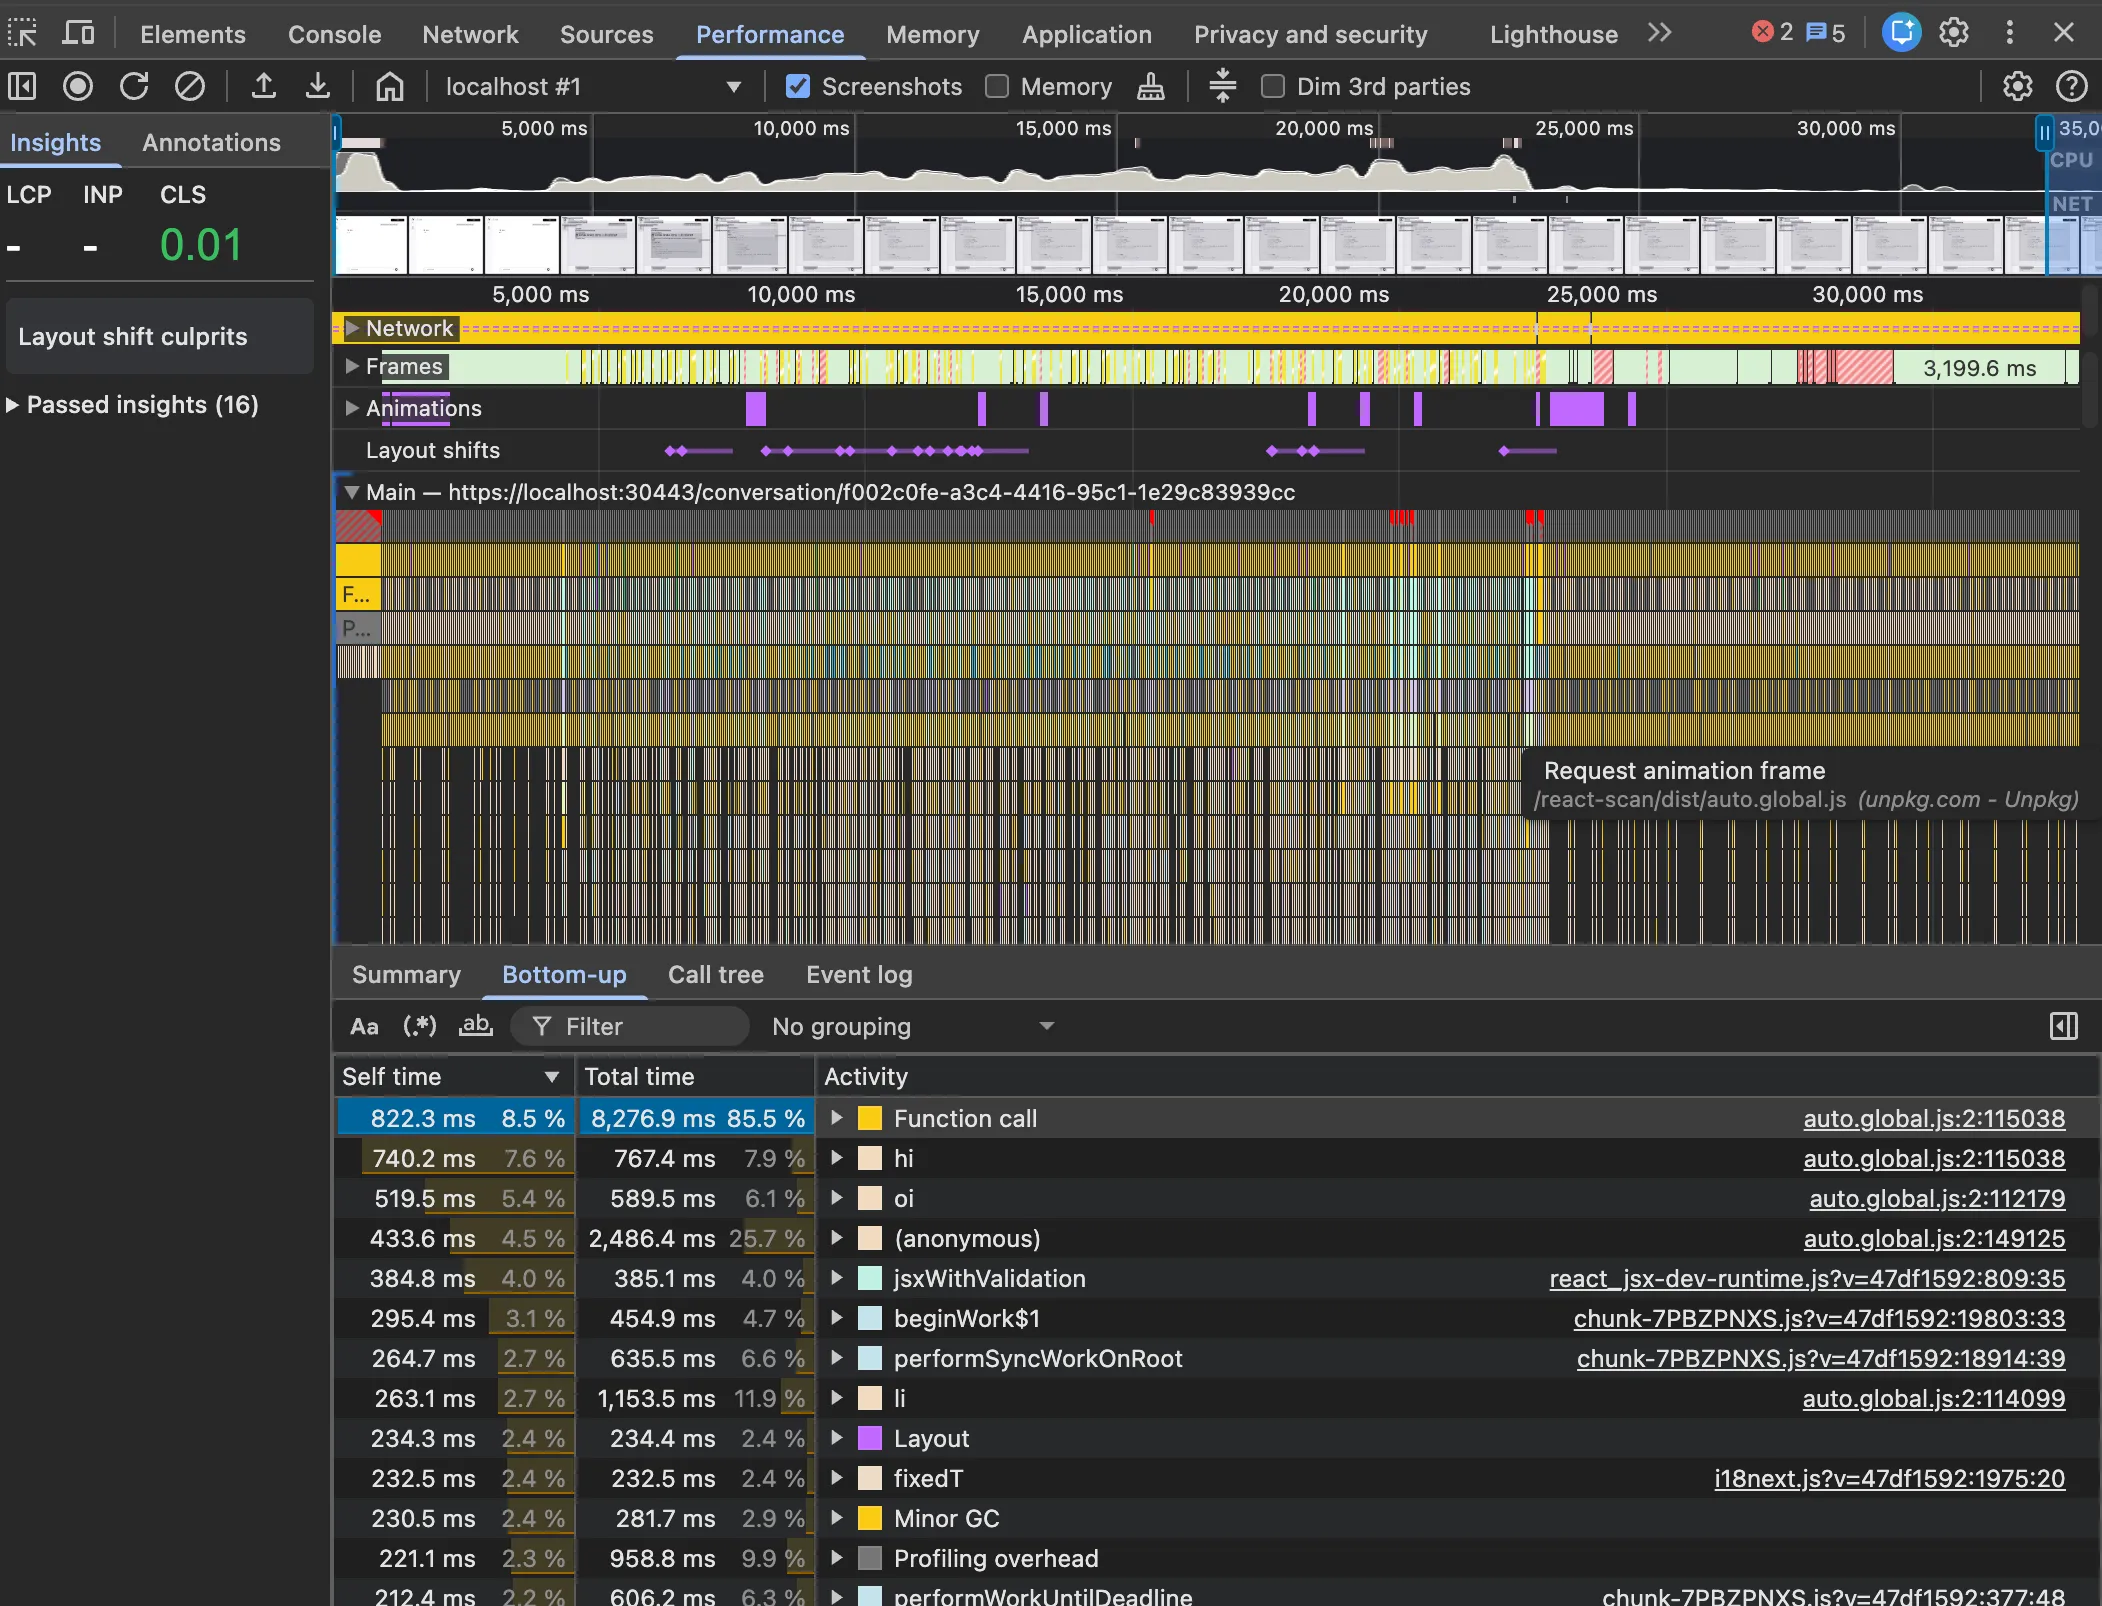
I also migrated the markdown to rehype-highlight and used useMemo to handle react-markdown props, which improved re-rendering performance according to react-scan:
Takeaway
Looking back at this problem, what strikes me most is how a seemingly complex issue came down to something simple—just misusing async/await.
Also in open-source community, people out there are working on some great tools that can be used and boost your website, super respect to their contributions.
If you’ve run into something like this before, I’d be curious to hear how you approached it. This is the final result: