From 3 FPS to Smooth: How a Misplaced async Froze Our Chat UI
TL;DR A walkthrough of how to identify and solve web performance issues using Chrome DevTools and react-scan.
While working on a React-based streaming chat UI, I ran into a serious performance issue, as shown in the video below:
As you can see from the FPS number at the top-right of the screen, it dropped to 3 FPS when performing heavy rendering tasks like syntax highlighting or custom markdown, and the browser would freeze in the worst cases—clearly not something you’d want to ship.
Chrome DevTools
So I opened Chrome DevTools, switched to the Performance tab, and recorded a flame graph to pinpoint where the issue was coming from.
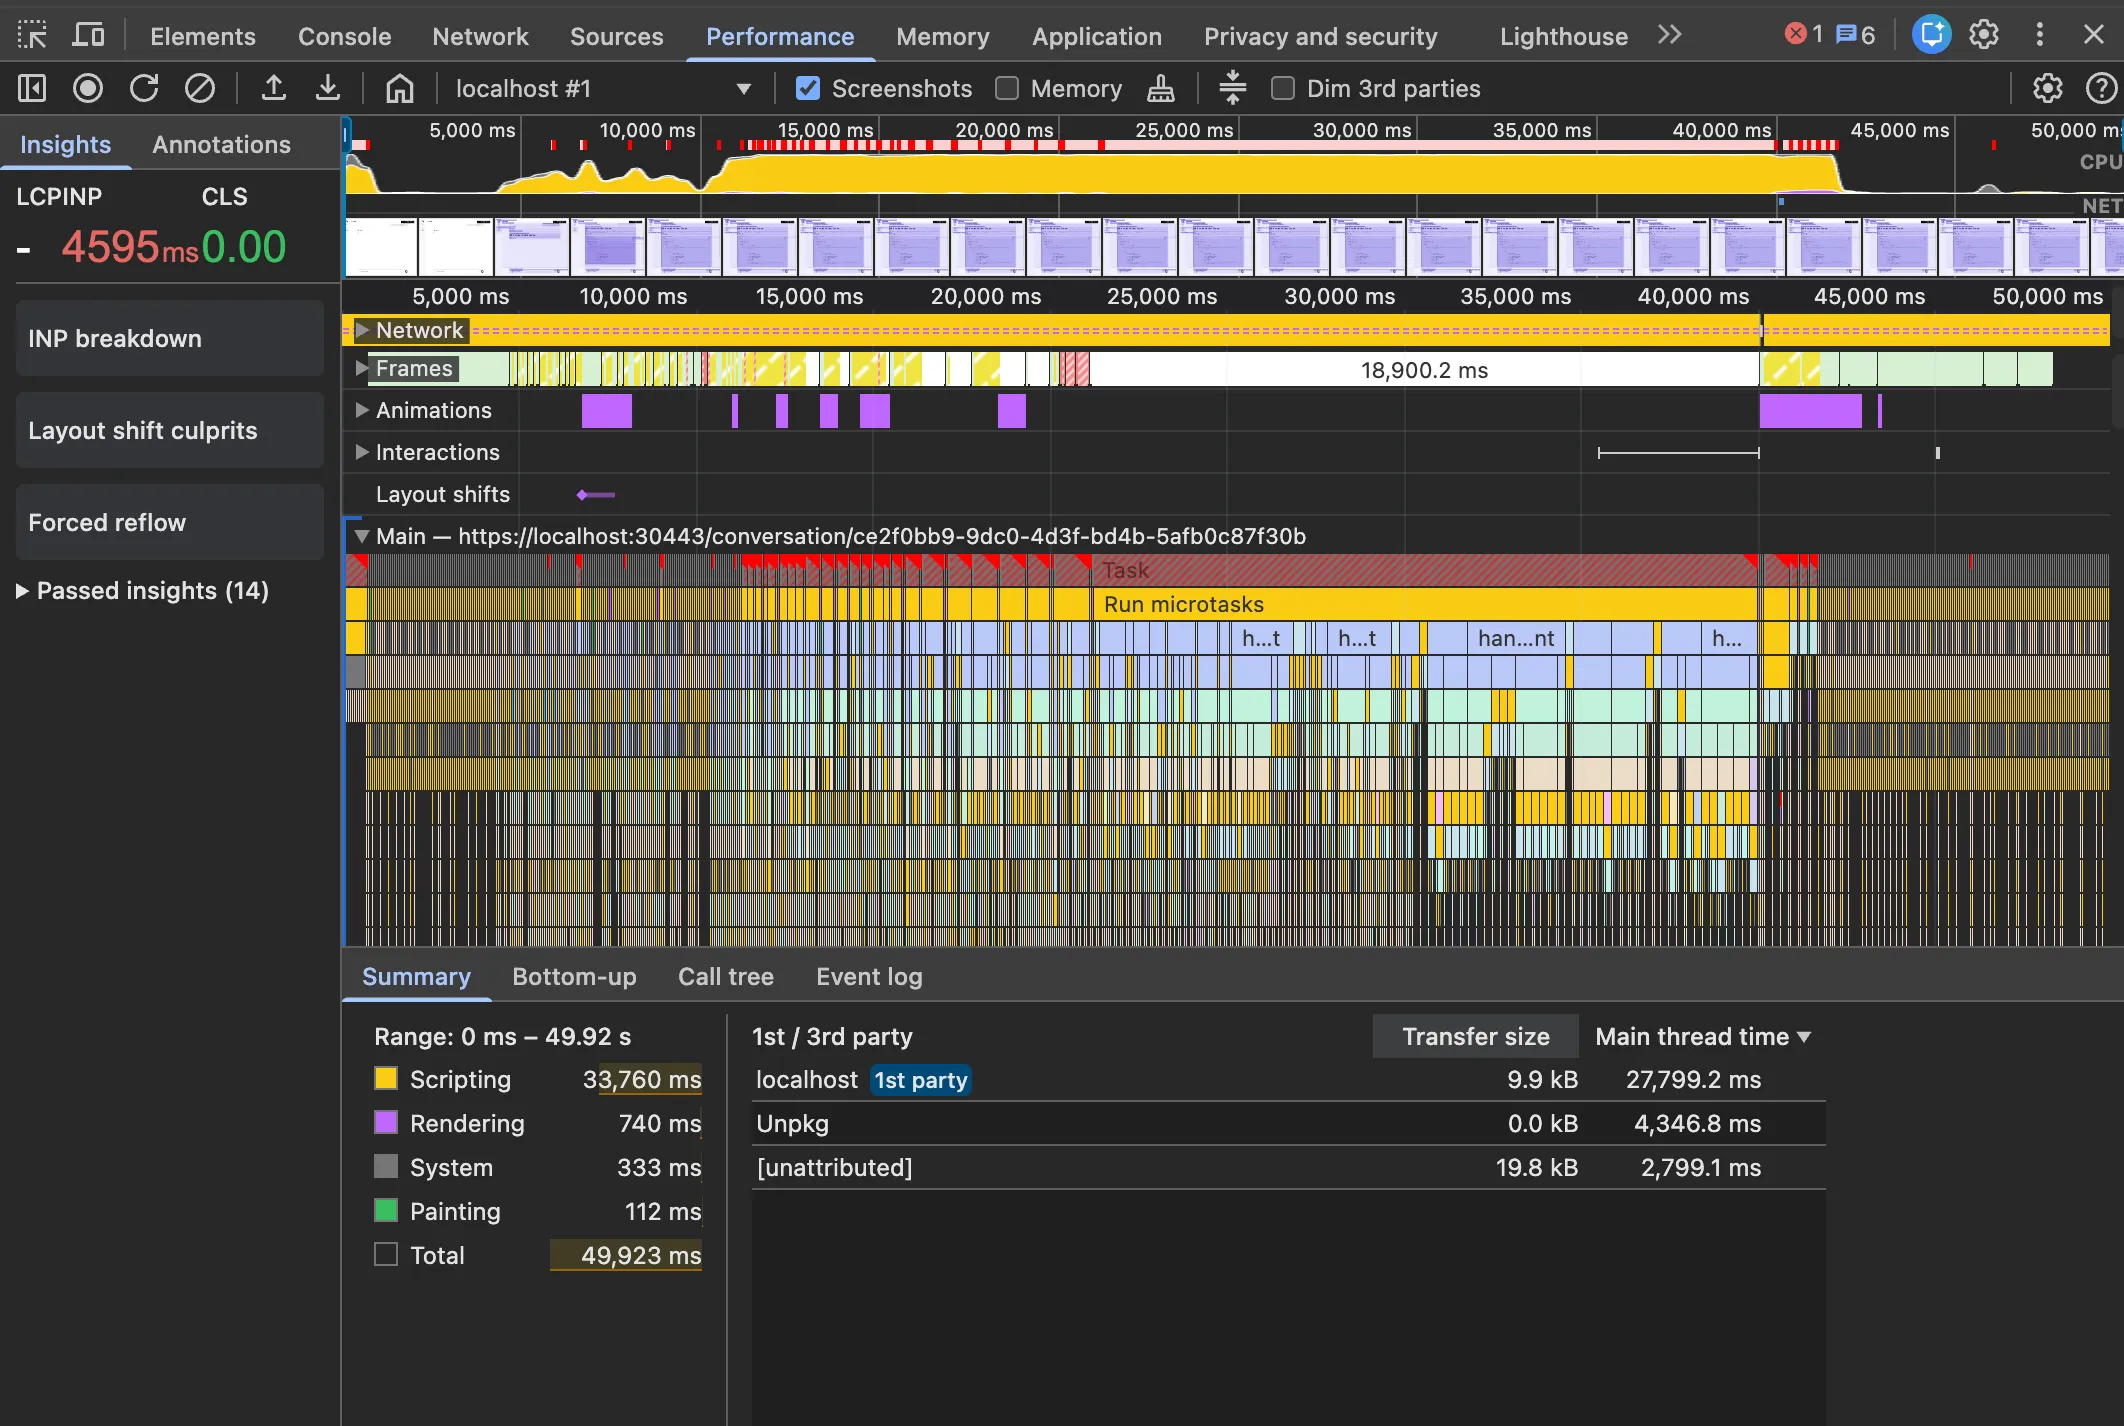
From the flame graph, we can see there were a lot of long tasks causing the browser to freeze. Clicking into one of the long tasks:
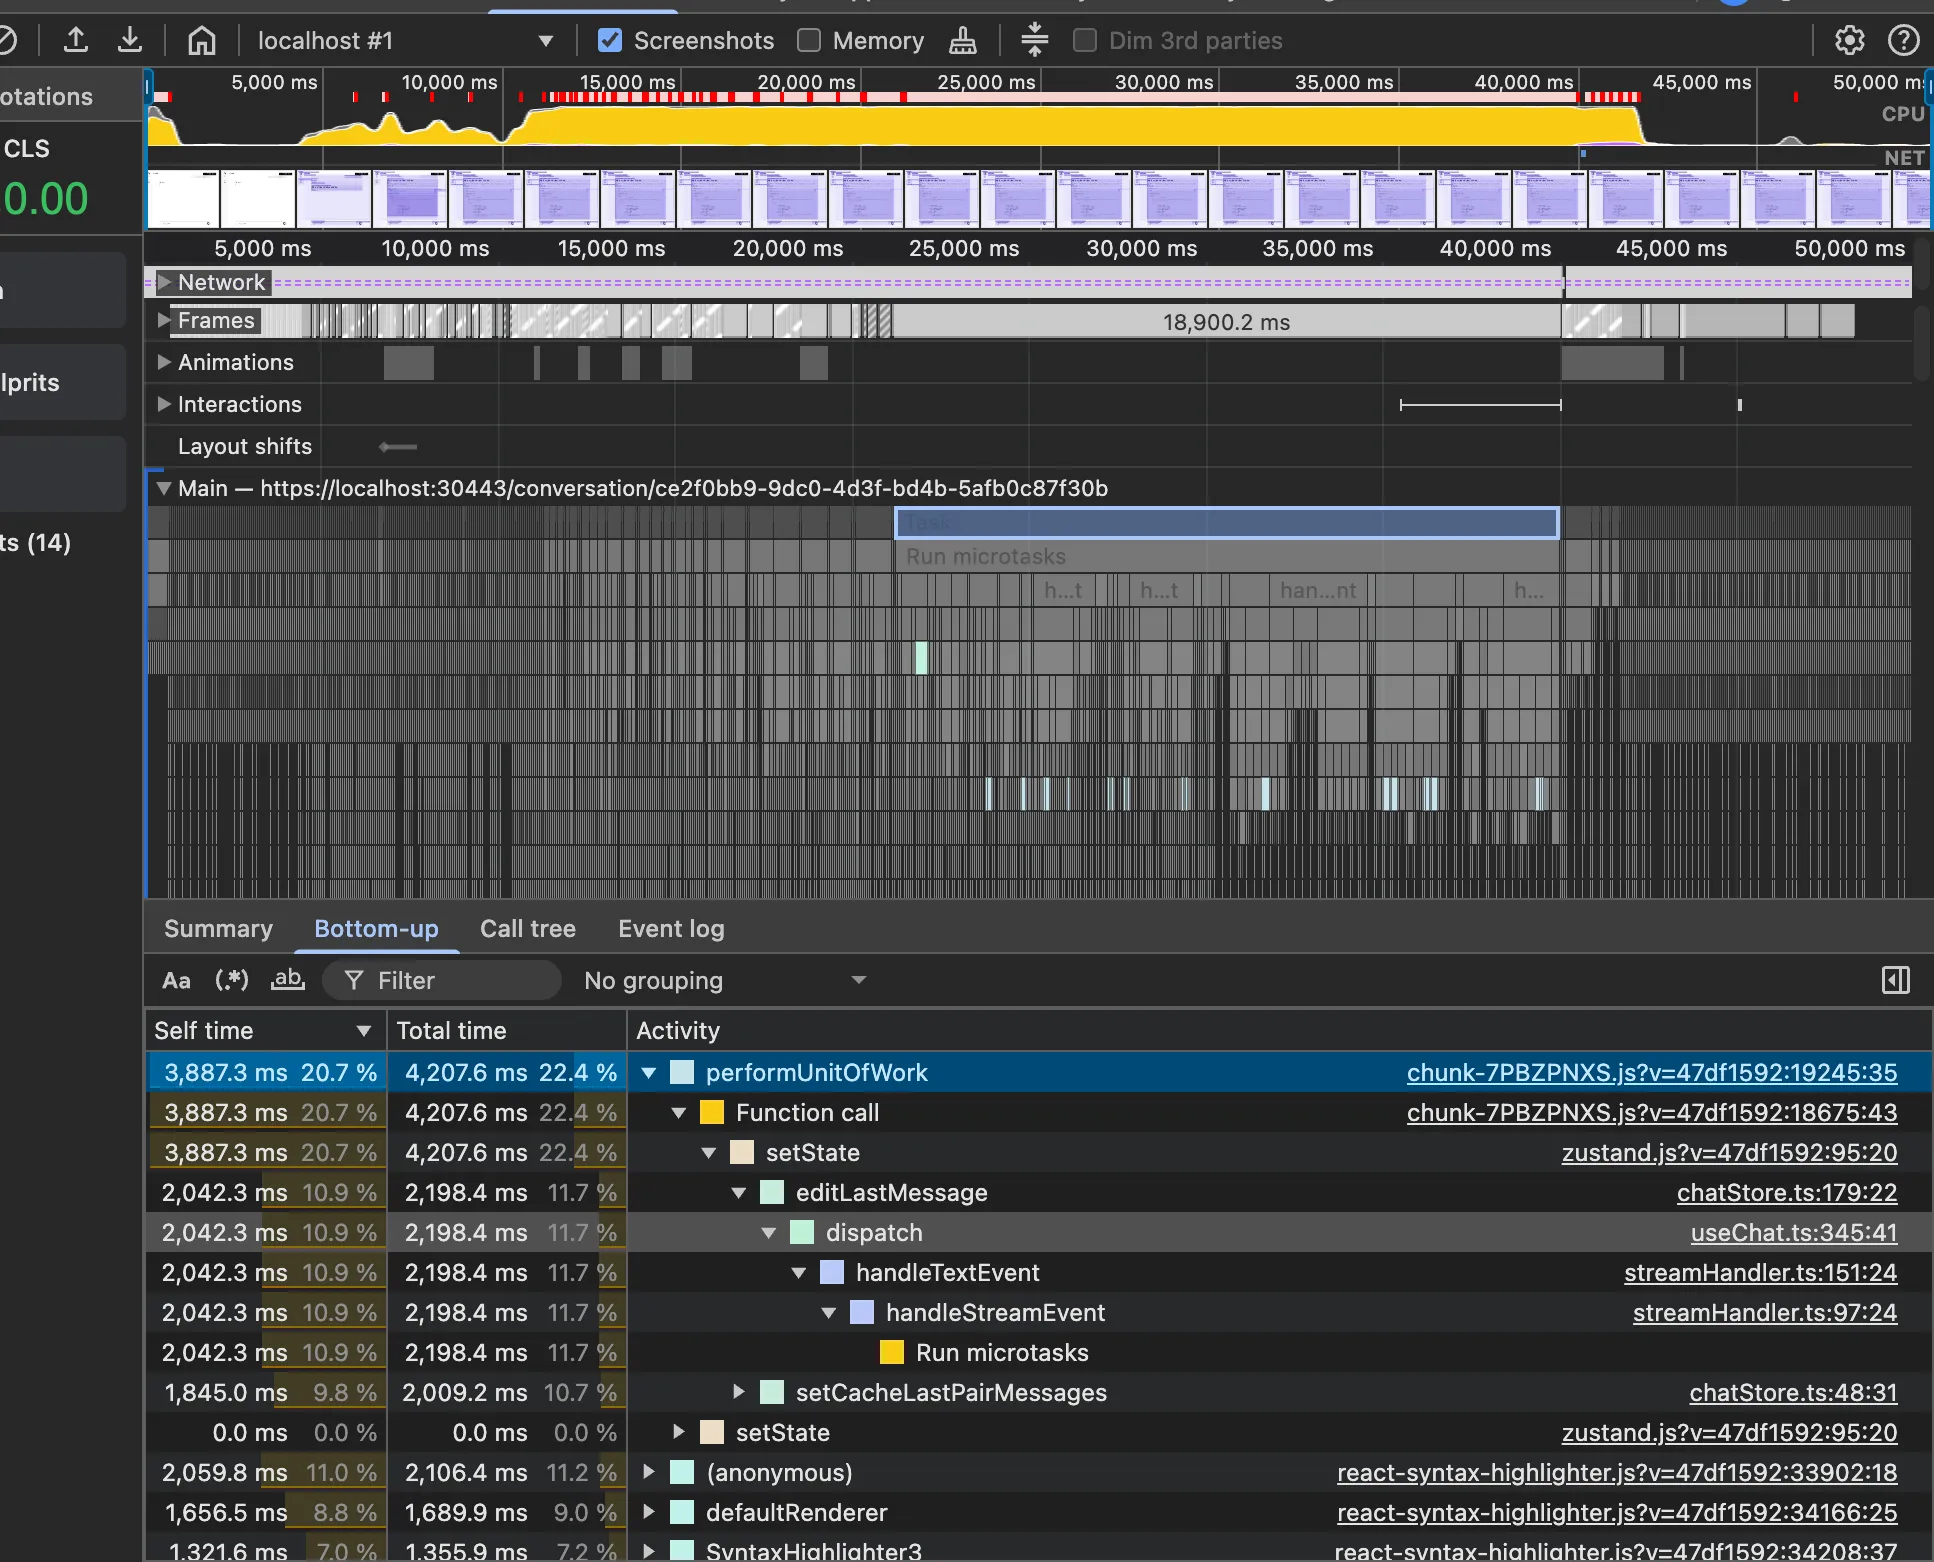
It looked like the browser was spending most of its time inside state updates and event handlers. At least now we knew where to start digging.
react-scan
react-scan automatically highlights re-rendering issues in a React app. After dropping it in and reproducing the lag, the syntax-highlighted code blocks lit up as an obvious offender:
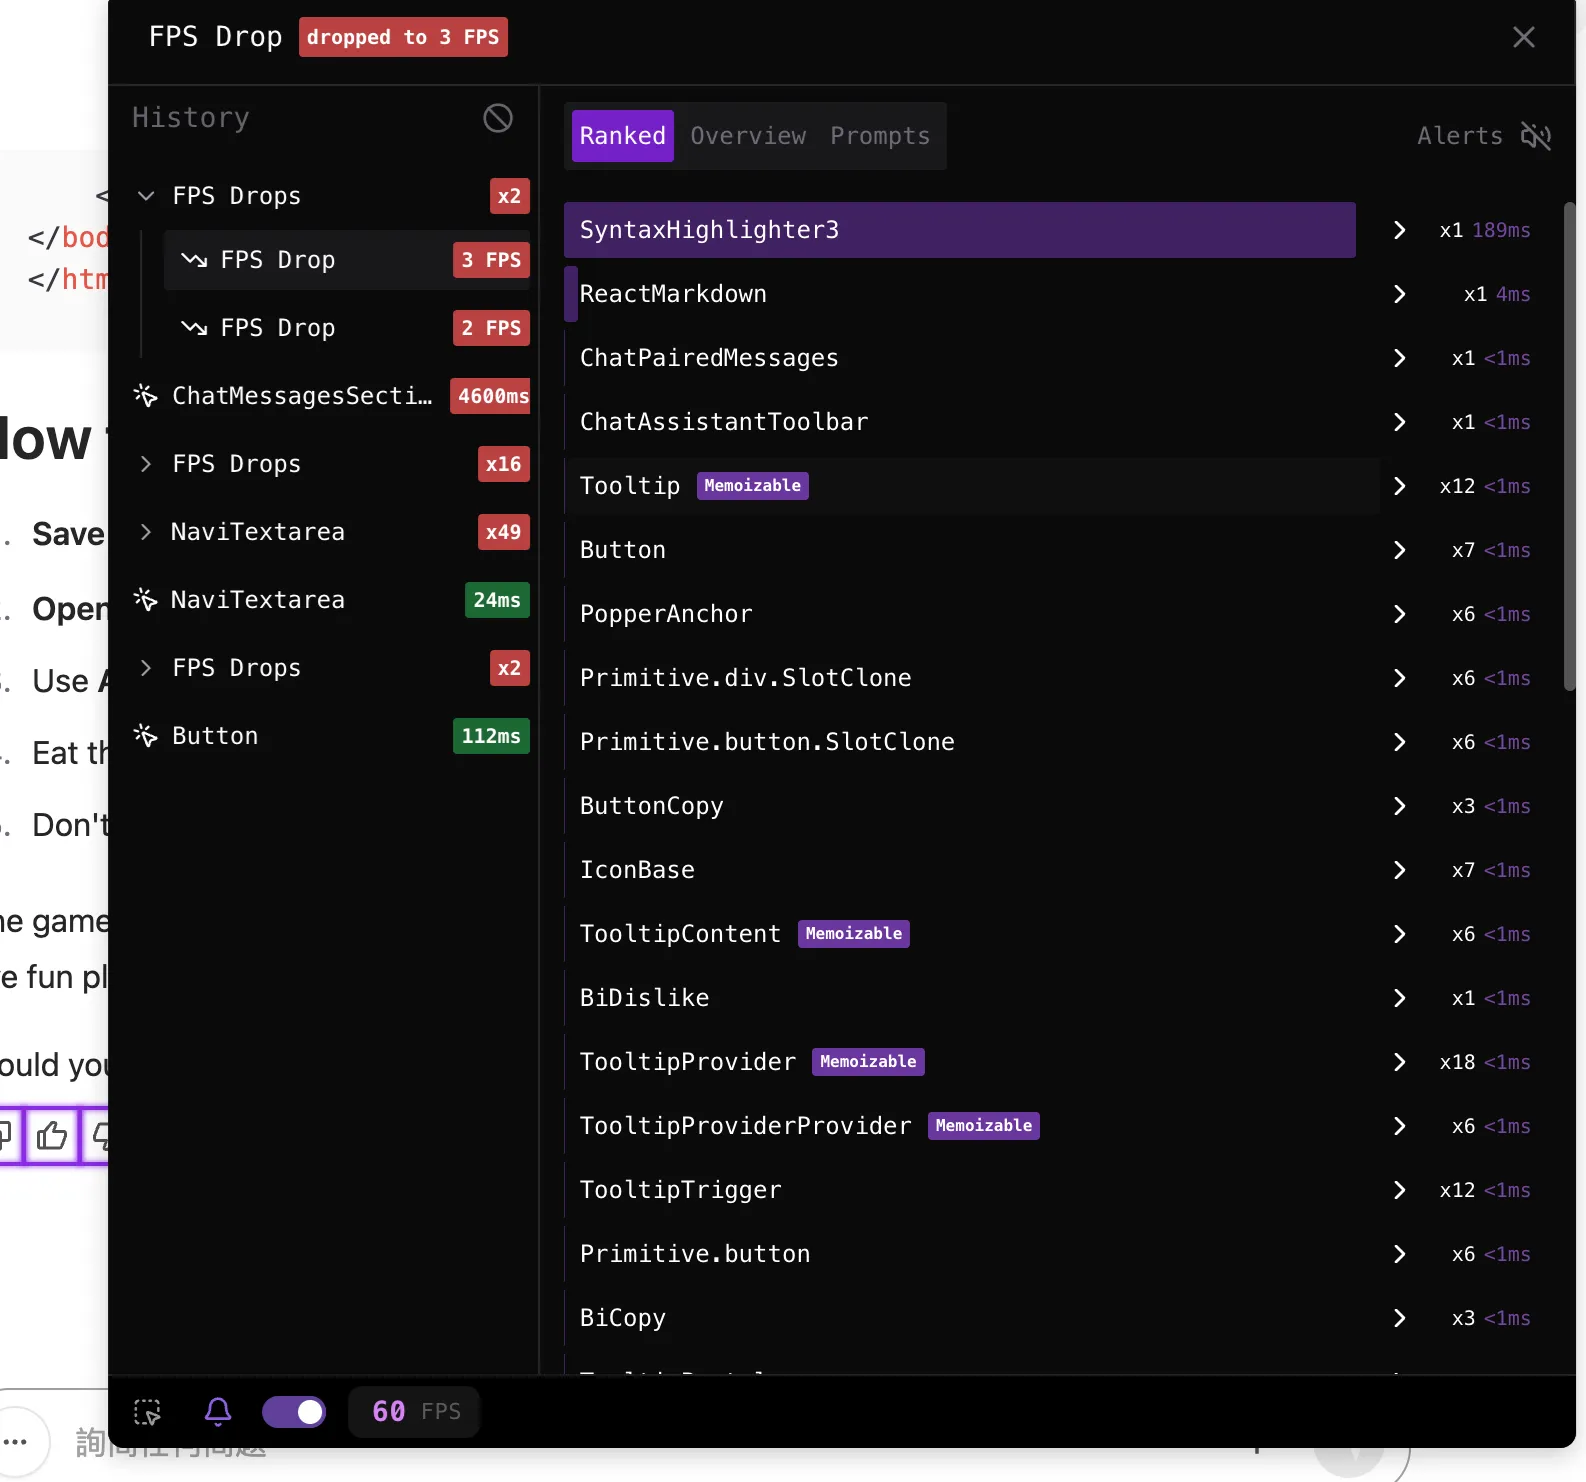
The app was using react-syntax-highlighter—easy to set up, but with known re-rendering overhead (there are a number of open GitHub issues on this). Swapping it for rehype-highlight turned out to be a better fit: it plugs straight into react-markdown and is much cheaper to re-render on streaming updates.
Root cause
The actual culprit turned out to be surprisingly simple: the main thread was drowning in microtasks. Here’s a minimal reproduction of the pattern:
// Called on every stream chunk
async function streamEventHandler(event) {
	if (event.type === 'text') return asyncJob('text', event.data);
	if (event.type === 'image') return asyncJob('image', event.data);
	if (event.type === 'end-event') return asyncJob('end-event', event.data);
	// ...
}

async function asyncJob(type, data) {
	handlerSyncJob(data);
	if (type === 'end-event') {
		await endStreamEvent();
	}
	//...
}
streamEventHandler is called on every stream chunk, which could be hundreds or thousands of times. Even though asyncJob() only actually awaits something on the end-event, the fact that it’s an async function means it always returns a Promise. This creates a cascade of microtasks:
- Create a Promise for every single stream chunk
- Queue all these Promises as microtasks in the event loop
- The browser processes all these microtasks before moving to the next macrotask (like rendering)
- With hundreds of microtasks to process, the main thread is blocked long enough that rendering can’t happen—creating a long task
The fix is to only use async when you actually need to await:
// Fixed version
function streamEventHandler(event) {
	if (event.type === 'text') return handlerSyncJob(event.data);
	if (event.type === 'image') return handlerSyncJob(event.data);
	if (event.type === 'end-event') return asyncJob(event.data);
}

async function asyncJob(data) {
	handlerSyncJob(data);
	await endStreamEvent(); // Only this path is async
}

function handlerSyncJob(data) {
	// Pure synchronous logic, no Promise
}
Now only the end-event path creates a Promise, which avoids the microtask overflow. After the fix, the long tasks in the flame graph drop significantly:
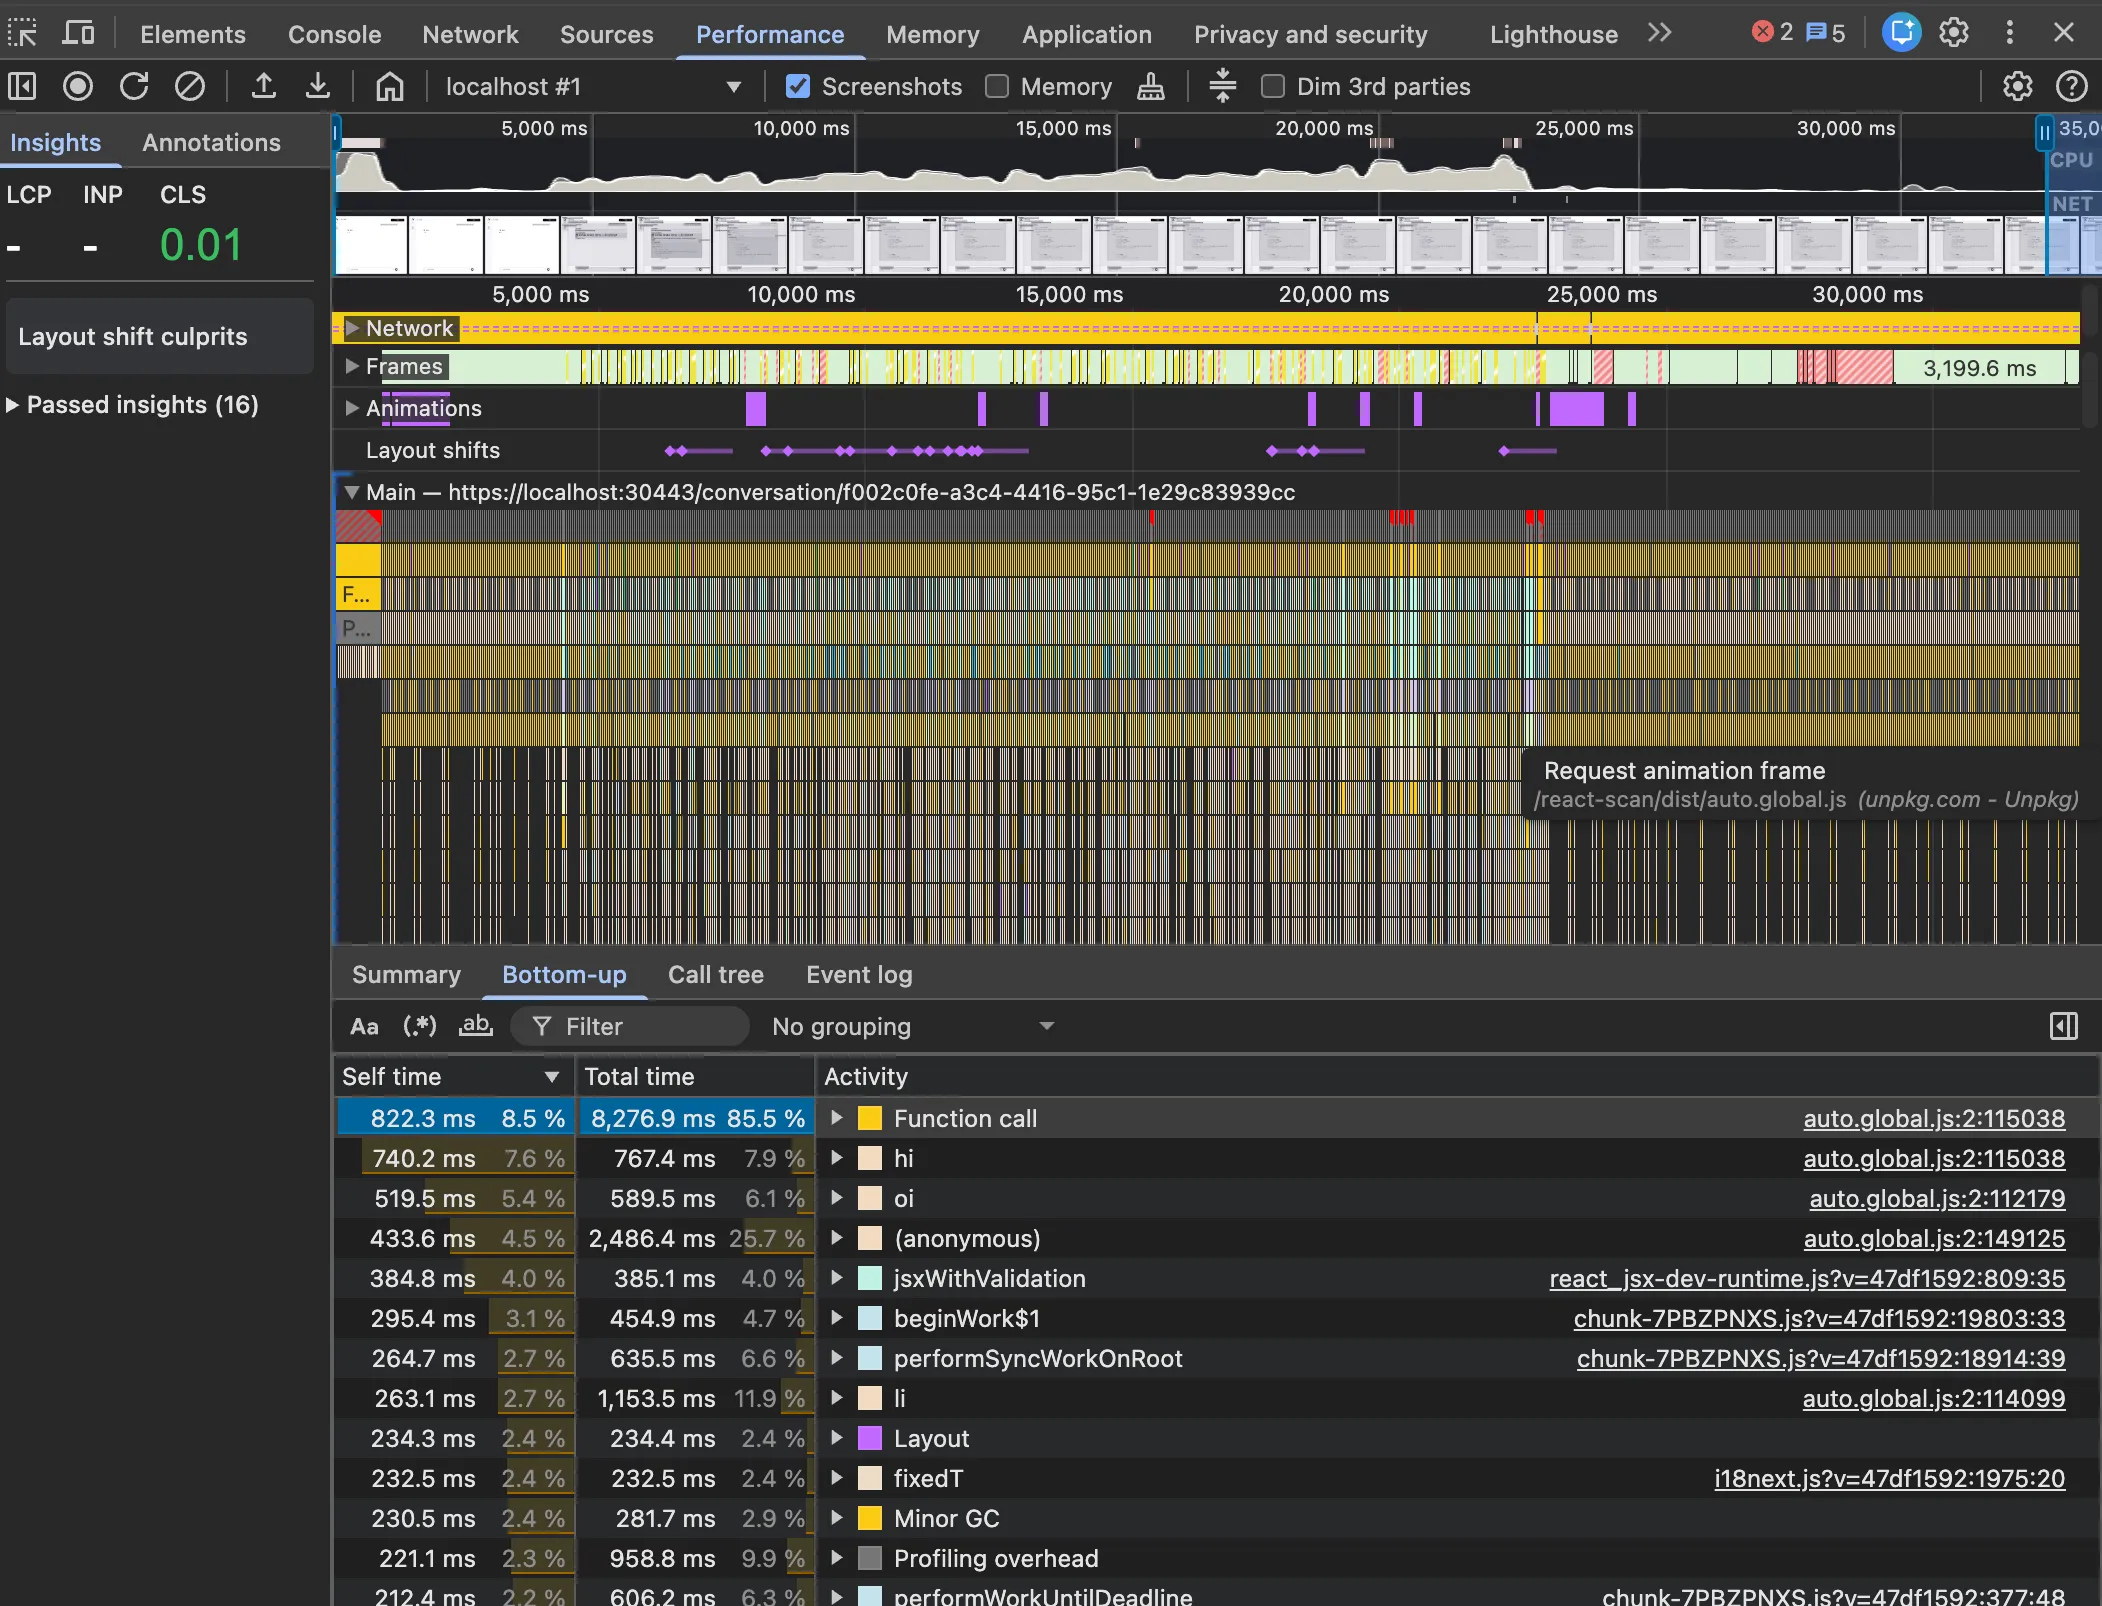
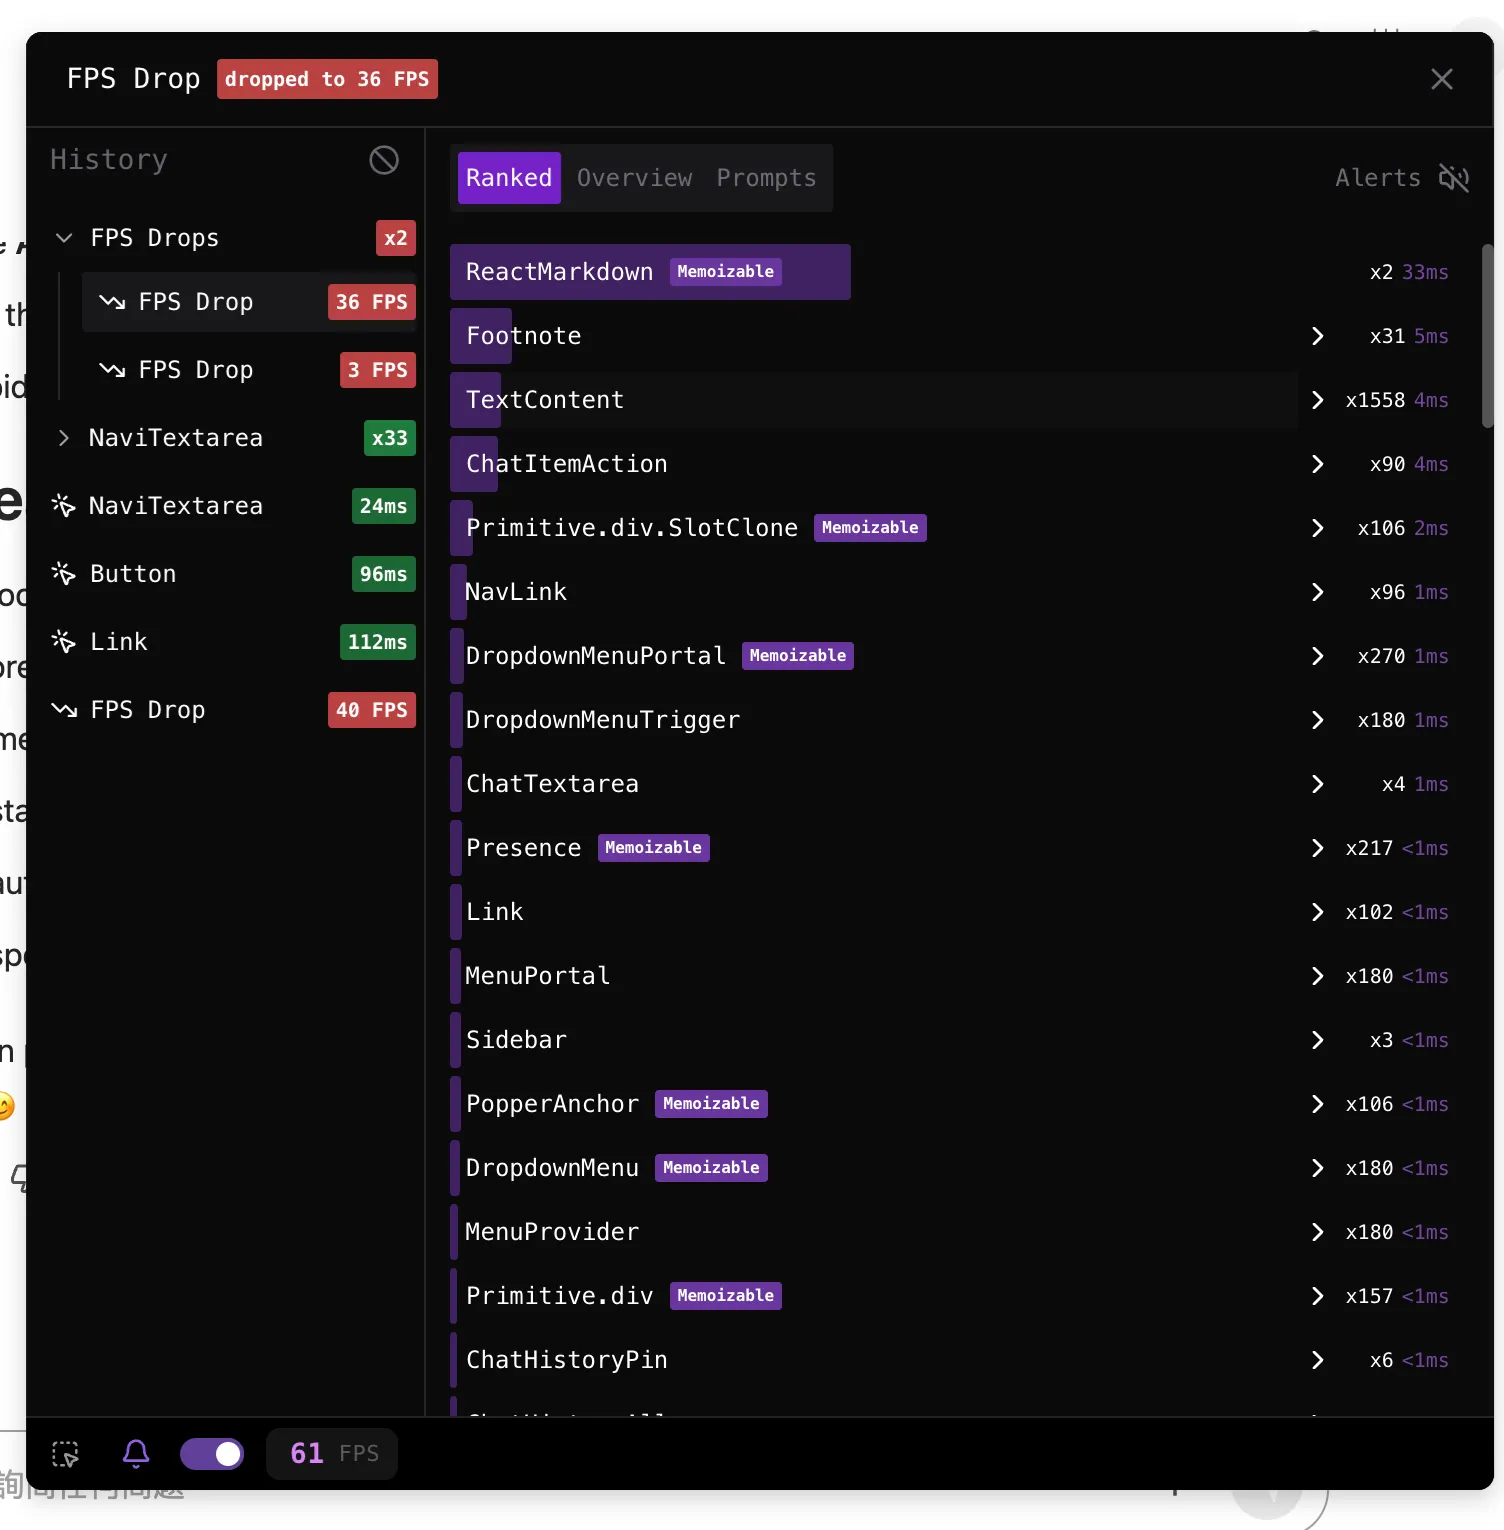
Combined with the move to rehype-highlight and a useMemo around the react-markdown props, re-rendering cost—measured via react-scan—went down noticeably too:
Takeaway
A problem that felt complex—3 FPS, frozen tabs, a flame graph full of long tasks—came down to an async keyword that didn’t need to be there.
A few things I’ll keep in mind next time:
- Flame graphs tell you where time is spent; react-scan tells you what is re-rendering. They’re most useful together.
asyncisn’t free. A function that returns a Promise on every call, multiplied by a streaming event loop, is its own kind of N+1 problem.
If you’ve hit something similar, I’d be curious how you diagnosed it. Here’s the final result: